import pandas as pdBroadcasting along columns
df = pd.read_csv('rates.csv', parse_dates=['Time'])
df| Time | USD | JPY | BGN | CZK | DKK | GBP | CHF | |
|---|---|---|---|---|---|---|---|---|
| 0 | 2024-01-17 | 1.0877 | 160.65 | 1.9558 | 24.755 | 7.4586 | 0.85818 | 0.9406 |
| 1 | 2024-01-16 | 1.0882 | 159.64 | 1.9558 | 24.710 | 7.4582 | 0.86078 | 0.9361 |
| 2 | 2024-01-15 | 1.0945 | 159.67 | 1.9558 | 24.714 | 7.4590 | 0.86075 | 0.9351 |
| 3 | 2024-01-12 | 1.0942 | 159.17 | 1.9558 | 24.689 | 7.4565 | 0.85950 | 0.9350 |
| 4 | 2024-01-11 | 1.0987 | 159.71 | 1.9558 | 24.659 | 7.4568 | 0.86145 | 0.9338 |
| ... | ... | ... | ... | ... | ... | ... | ... | ... |
| 56 | 2023-10-26 | 1.0540 | 158.48 | 1.9558 | 24.714 | 7.4632 | 0.87170 | 0.9466 |
| 57 | 2023-10-25 | 1.0576 | 158.55 | 1.9558 | 24.693 | 7.4639 | 0.87240 | 0.9474 |
| 58 | 2023-10-24 | 1.0632 | 159.26 | 1.9558 | 24.659 | 7.4648 | 0.87025 | 0.9501 |
| 59 | 2023-10-23 | 1.0597 | 158.91 | 1.9558 | 24.645 | 7.4634 | 0.87153 | 0.9461 |
| 60 | 2023-10-20 | 1.0591 | 158.80 | 1.9558 | 24.704 | 7.4620 | 0.87213 | 0.9442 |
61 rows × 8 columns
if 'Time' in df.columns:
    df.index = df['Time']
    df = df.drop(columns=['Time'])
df.head()| USD | JPY | BGN | CZK | DKK | GBP | CHF | |
|---|---|---|---|---|---|---|---|
| Time | |||||||
| 2024-01-17 | 1.0877 | 160.65 | 1.9558 | 24.755 | 7.4586 | 0.85818 | 0.9406 |
| 2024-01-16 | 1.0882 | 159.64 | 1.9558 | 24.710 | 7.4582 | 0.86078 | 0.9361 |
| 2024-01-15 | 1.0945 | 159.67 | 1.9558 | 24.714 | 7.4590 | 0.86075 | 0.9351 |
| 2024-01-12 | 1.0942 | 159.17 | 1.9558 | 24.689 | 7.4565 | 0.85950 | 0.9350 |
| 2024-01-11 | 1.0987 | 159.71 | 1.9558 | 24.659 | 7.4568 | 0.86145 | 0.9338 |
df.mean()USD 1.083367
JPY 159.357377
BGN 1.955800
CZK 24.536525
DKK 7.458064
GBP 0.866149
CHF 0.949808
dtype: float64type(df.mean())pandas.core.series.Seriesdf - df.mean()| USD | JPY | BGN | CZK | DKK | GBP | CHF | |
|---|---|---|---|---|---|---|---|
| Time | |||||||
| 2024-01-17 | 0.004333 | 1.292623 | 2.220446e-16 | 0.218475 | 0.000536 | -0.007969 | -0.009208 |
| 2024-01-16 | 0.004833 | 0.282623 | 2.220446e-16 | 0.173475 | 0.000136 | -0.005369 | -0.013708 |
| 2024-01-15 | 0.011133 | 0.312623 | 2.220446e-16 | 0.177475 | 0.000936 | -0.005399 | -0.014708 |
| 2024-01-12 | 0.010833 | -0.187377 | 2.220446e-16 | 0.152475 | -0.001564 | -0.006649 | -0.014808 |
| 2024-01-11 | 0.015333 | 0.352623 | 2.220446e-16 | 0.122475 | -0.001264 | -0.004699 | -0.016008 |
| ... | ... | ... | ... | ... | ... | ... | ... |
| 2023-10-26 | -0.029367 | -0.877377 | 2.220446e-16 | 0.177475 | 0.005136 | 0.005551 | -0.003208 |
| 2023-10-25 | -0.025767 | -0.807377 | 2.220446e-16 | 0.156475 | 0.005836 | 0.006251 | -0.002408 |
| 2023-10-24 | -0.020167 | -0.097377 | 2.220446e-16 | 0.122475 | 0.006736 | 0.004101 | 0.000292 |
| 2023-10-23 | -0.023667 | -0.447377 | 2.220446e-16 | 0.108475 | 0.005336 | 0.005381 | -0.003708 |
| 2023-10-20 | -0.024267 | -0.557377 | 2.220446e-16 | 0.167475 | 0.003936 | 0.005981 | -0.005608 |
61 rows × 7 columns
df.sub(df.mean()).mean() # almost zero: successUSD -1.456030e-16
JPY 4.193367e-14
BGN 2.220446e-16
CZK -1.048342e-15
DKK 5.387312e-16
GBP 1.310427e-16
CHF 3.094064e-17
dtype: float64df.sub(df.mean(), axis="columns")| USD | JPY | BGN | CZK | DKK | GBP | CHF | |
|---|---|---|---|---|---|---|---|
| Time | |||||||
| 2024-01-17 | 0.004333 | 1.292623 | 2.220446e-16 | 0.218475 | 0.000536 | -0.007969 | -0.009208 |
| 2024-01-16 | 0.004833 | 0.282623 | 2.220446e-16 | 0.173475 | 0.000136 | -0.005369 | -0.013708 |
| 2024-01-15 | 0.011133 | 0.312623 | 2.220446e-16 | 0.177475 | 0.000936 | -0.005399 | -0.014708 |
| 2024-01-12 | 0.010833 | -0.187377 | 2.220446e-16 | 0.152475 | -0.001564 | -0.006649 | -0.014808 |
| 2024-01-11 | 0.015333 | 0.352623 | 2.220446e-16 | 0.122475 | -0.001264 | -0.004699 | -0.016008 |
| ... | ... | ... | ... | ... | ... | ... | ... |
| 2023-10-26 | -0.029367 | -0.877377 | 2.220446e-16 | 0.177475 | 0.005136 | 0.005551 | -0.003208 |
| 2023-10-25 | -0.025767 | -0.807377 | 2.220446e-16 | 0.156475 | 0.005836 | 0.006251 | -0.002408 |
| 2023-10-24 | -0.020167 | -0.097377 | 2.220446e-16 | 0.122475 | 0.006736 | 0.004101 | 0.000292 |
| 2023-10-23 | -0.023667 | -0.447377 | 2.220446e-16 | 0.108475 | 0.005336 | 0.005381 | -0.003708 |
| 2023-10-20 | -0.024267 | -0.557377 | 2.220446e-16 | 0.167475 | 0.003936 | 0.005981 | -0.005608 |
61 rows × 7 columns
# also works, but maybe less explicit than axis="columns"
df.sub(df.mean(), axis=1).mean()
USD -1.456030e-16
JPY 4.193367e-14
BGN 2.220446e-16
CZK -1.048342e-15
DKK 5.387312e-16
GBP 1.310427e-16
CHF 3.094064e-17
dtype: float64df_standardized = (df-df.mean())/df.std()df_standardized2 = df.sub(df.mean()).div(df.std())# most explicit
df_standardized3 = df.sub(df.mean(), axis="columns").div(df.std(), axis="columns")df_standardized4 = df.sub(df.mean(), axis=1).div(df.std(), axis=1)((df_standardized4-df_standardized) == 0.).all()USD True
JPY True
BGN True
CZK True
DKK True
GBP True
CHF True
dtype: booldf_max_standardized = df/df.max()
df_standardized.columns = ['rate_' + c for c in df.columns]
df_long = pd.wide_to_long(df_standardized.reset_index(), stubnames=["rate_"], i='Time', j='currency', suffix='[A-Z]*')
df_long| rate_ | ||
|---|---|---|
| Time | currency | |
| 2024-01-17 | USD | 0.292474 |
| 2024-01-16 | USD | 0.326226 |
| 2024-01-15 | USD | 0.751492 |
| 2024-01-12 | USD | 0.731241 |
| 2024-01-11 | USD | 1.035003 |
| ... | ... | ... |
| 2023-10-26 | CHF | -0.260963 |
| 2023-10-25 | CHF | -0.195889 |
| 2023-10-24 | CHF | 0.023736 |
| 2023-10-23 | CHF | -0.301634 |
| 2023-10-20 | CHF | -0.456185 |
427 rows × 1 columns
import seaborn as sns
sns.relplot(data=df_long,
            x='Time',
            y='rate_',
            hue='currency',
            kind='line',
            height=5,
            aspect=4)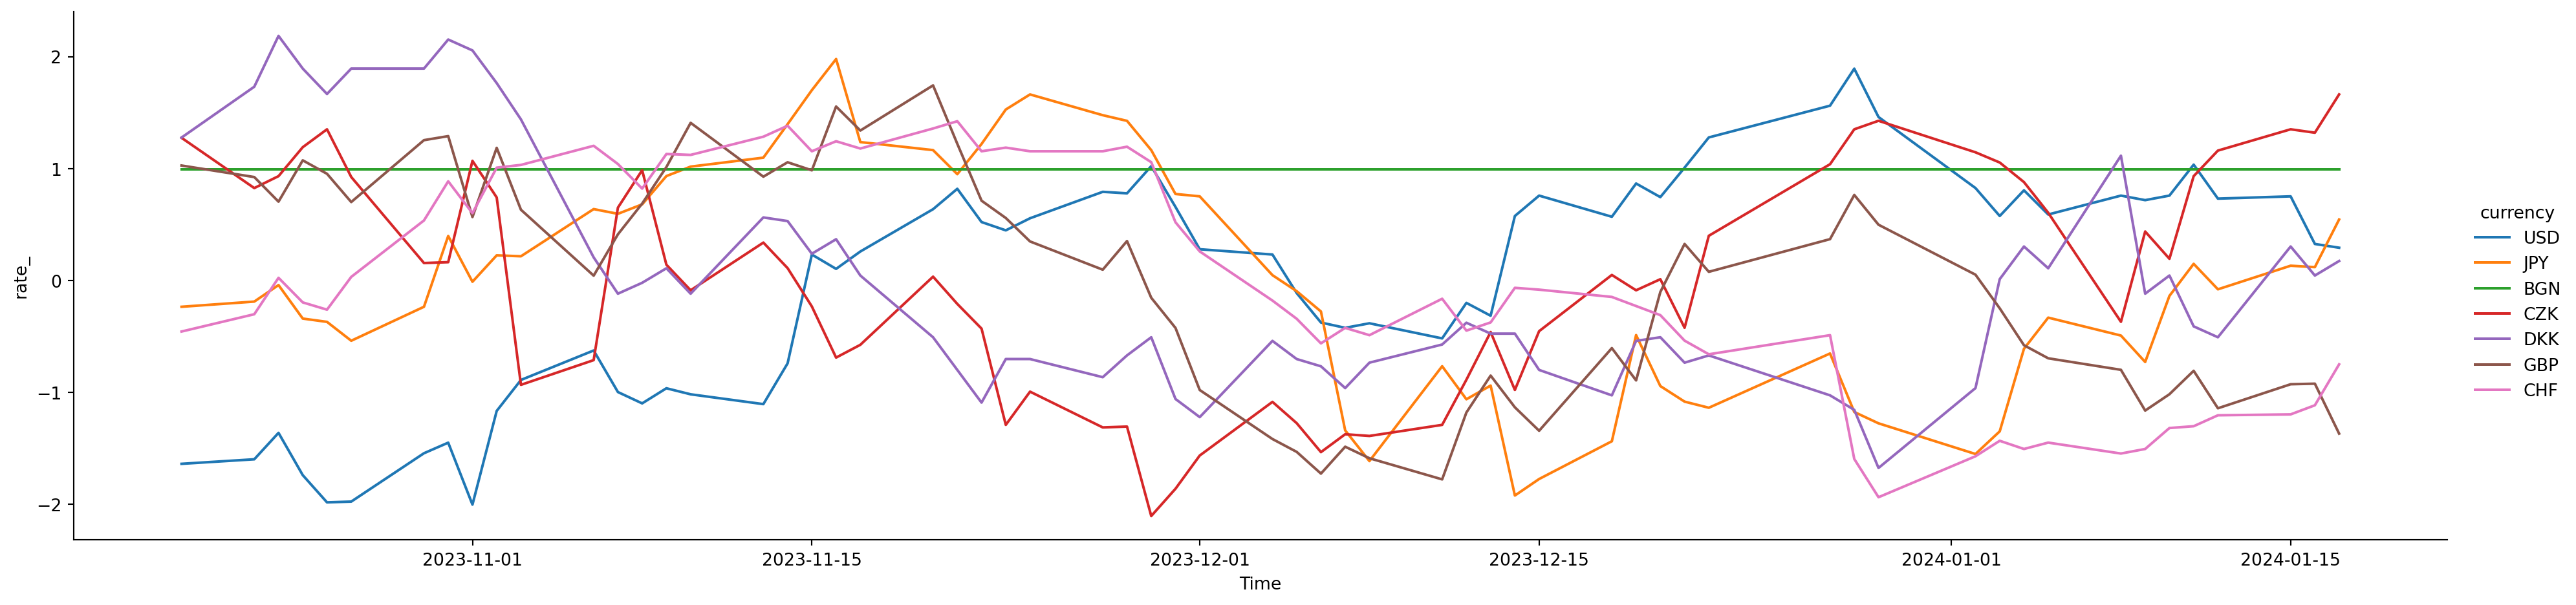
df.BGNTime
2024-01-17 1.9558
2024-01-16 1.9558
2024-01-15 1.9558
2024-01-12 1.9558
2024-01-11 1.9558
...
2023-10-26 1.9558
2023-10-25 1.9558
2023-10-24 1.9558
2023-10-23 1.9558
2023-10-20 1.9558
Name: BGN, Length: 61, dtype: float64Broadcasting along columns
df.USDTime
2024-01-17 1.0877
2024-01-16 1.0882
2024-01-15 1.0945
2024-01-12 1.0942
2024-01-11 1.0987
...
2023-10-26 1.0540
2023-10-25 1.0576
2023-10-24 1.0632
2023-10-23 1.0597
2023-10-20 1.0591
Name: USD, Length: 61, dtype: float64type(df.USD)pandas.core.series.Seriesdf - df.USD # complete failure to do what we want| 2023-10-20 00:00:00 | 2023-10-23 00:00:00 | 2023-10-24 00:00:00 | 2023-10-25 00:00:00 | 2023-10-26 00:00:00 | 2023-10-27 00:00:00 | 2023-10-30 00:00:00 | 2023-10-31 00:00:00 | 2023-11-01 00:00:00 | 2023-11-02 00:00:00 | ... | 2024-01-15 00:00:00 | 2024-01-16 00:00:00 | 2024-01-17 00:00:00 | BGN | CHF | CZK | DKK | GBP | JPY | USD | |
|---|---|---|---|---|---|---|---|---|---|---|---|---|---|---|---|---|---|---|---|---|---|
| Time | |||||||||||||||||||||
| 2024-01-17 | NaN | NaN | NaN | NaN | NaN | NaN | NaN | NaN | NaN | NaN | ... | NaN | NaN | NaN | NaN | NaN | NaN | NaN | NaN | NaN | NaN |
| 2024-01-16 | NaN | NaN | NaN | NaN | NaN | NaN | NaN | NaN | NaN | NaN | ... | NaN | NaN | NaN | NaN | NaN | NaN | NaN | NaN | NaN | NaN |
| 2024-01-15 | NaN | NaN | NaN | NaN | NaN | NaN | NaN | NaN | NaN | NaN | ... | NaN | NaN | NaN | NaN | NaN | NaN | NaN | NaN | NaN | NaN |
| 2024-01-12 | NaN | NaN | NaN | NaN | NaN | NaN | NaN | NaN | NaN | NaN | ... | NaN | NaN | NaN | NaN | NaN | NaN | NaN | NaN | NaN | NaN |
| 2024-01-11 | NaN | NaN | NaN | NaN | NaN | NaN | NaN | NaN | NaN | NaN | ... | NaN | NaN | NaN | NaN | NaN | NaN | NaN | NaN | NaN | NaN |
| ... | ... | ... | ... | ... | ... | ... | ... | ... | ... | ... | ... | ... | ... | ... | ... | ... | ... | ... | ... | ... | ... |
| 2023-10-26 | NaN | NaN | NaN | NaN | NaN | NaN | NaN | NaN | NaN | NaN | ... | NaN | NaN | NaN | NaN | NaN | NaN | NaN | NaN | NaN | NaN |
| 2023-10-25 | NaN | NaN | NaN | NaN | NaN | NaN | NaN | NaN | NaN | NaN | ... | NaN | NaN | NaN | NaN | NaN | NaN | NaN | NaN | NaN | NaN |
| 2023-10-24 | NaN | NaN | NaN | NaN | NaN | NaN | NaN | NaN | NaN | NaN | ... | NaN | NaN | NaN | NaN | NaN | NaN | NaN | NaN | NaN | NaN |
| 2023-10-23 | NaN | NaN | NaN | NaN | NaN | NaN | NaN | NaN | NaN | NaN | ... | NaN | NaN | NaN | NaN | NaN | NaN | NaN | NaN | NaN | NaN |
| 2023-10-20 | NaN | NaN | NaN | NaN | NaN | NaN | NaN | NaN | NaN | NaN | ... | NaN | NaN | NaN | NaN | NaN | NaN | NaN | NaN | NaN | NaN |
61 rows × 68 columns
import numpy as np
dummy_df = pd.DataFrame(np.arange(12).reshape((4, 3)), columns=['a', 'b', 'c'])
dummy_s = pd.Series(np.arange(3), index=['b', 'c', 'd'])
dummy_df - dummy_s| a | b | c | d | |
|---|---|---|---|---|
| 0 | NaN | 1.0 | 1.0 | NaN |
| 1 | NaN | 4.0 | 4.0 | NaN |
| 2 | NaN | 7.0 | 7.0 | NaN |
| 3 | NaN | 10.0 | 10.0 | NaN |
df - df.USD.values # fails because the lengths don't matchValueError: Unable to coerce to Series, length must be 7: given 61df.div(df.USD, axis="rows") # subtraction| USD | JPY | BGN | CZK | DKK | GBP | CHF | |
|---|---|---|---|---|---|---|---|
| Time | |||||||
| 2024-01-17 | 1.0 | 147.696975 | 1.798106 | 22.759033 | 6.857222 | 0.788986 | 0.864761 |
| 2024-01-16 | 1.0 | 146.700974 | 1.797280 | 22.707223 | 6.853703 | 0.791013 | 0.860228 |
| 2024-01-15 | 1.0 | 145.883965 | 1.786935 | 22.580174 | 6.814984 | 0.786432 | 0.854363 |
| 2024-01-12 | 1.0 | 145.467008 | 1.787425 | 22.563517 | 6.814568 | 0.785505 | 0.854506 |
| 2024-01-11 | 1.0 | 145.362701 | 1.780104 | 22.443797 | 6.786930 | 0.784063 | 0.849914 |
| ... | ... | ... | ... | ... | ... | ... | ... |
| 2023-10-26 | 1.0 | 150.360531 | 1.855598 | 23.447818 | 7.080835 | 0.827040 | 0.898102 |
| 2023-10-25 | 1.0 | 149.914902 | 1.849281 | 23.348147 | 7.057394 | 0.824887 | 0.895802 |
| 2023-10-24 | 1.0 | 149.793078 | 1.839541 | 23.193190 | 7.021068 | 0.818520 | 0.893623 |
| 2023-10-23 | 1.0 | 149.957535 | 1.845617 | 23.256582 | 7.042937 | 0.822431 | 0.892800 |
| 2023-10-20 | 1.0 | 149.938627 | 1.846662 | 23.325465 | 7.045605 | 0.823463 | 0.891512 |
61 rows × 7 columns